Clients want proof their ad budgets are delivering. The real challenge? Giving them the clarity and confidence they expect, without overwhelming them with data or confusing jargon.
That’s where this guide comes in. If you’ve ever wondered how to show google ads performance to clients in a way that makes sense, builds trust, and drives action, you’re in the right place.
We’ll break down the essential metrics every client cares about, explore visualization techniques that make results pop, cover the best reporting tools for 2026, and share proven communication strategies. Ready for practical, actionable tips that help you simplify reporting and impress your clients? Let’s dive in.
Understanding What Clients Really Want to See
When thinking about how to show google ads performance to clients, it's vital to step into their shoes. Clients aren't just looking for numbers—they want clarity, relevance, and proof that their investment is working. Let's break down what really matters to them, so your reports hit the mark every time.
Defining Client Goals and Expectations
Every successful report starts with a clear understanding of what clients want to achieve. Before you even consider how to show google ads performance to clients, get aligned on their business goals. Are they aiming for more sales, cheaper leads, or broader brand awareness?
For example, e-commerce brands often zero in on Return on Ad Spend (ROAS), while lead generation businesses care about Cost Per Lead (CPL). If a client wants brand awareness, impressions and reach take center stage. According to WordStream, 72% of clients rank ROI as their top metric.
Regular check-ins are crucial. They help you refine what matters most and keep your reporting focused on real results, not vanity numbers.
Common Pain Points in Google Ads Reporting
It's all too common for clients to receive a 20-page report and feel more confused than informed. The challenge with how to show google ads performance to clients often comes down to data overload, lack of context, and jargon-heavy explanations.
Imagine a client sifting through endless tables but still unsure if their ads are truly working. In fact, Search Engine Journal found that 60% of agencies say clients struggle to interpret standard Google Ads reports. The takeaway? Simplicity and actionable insights are key. If you're looking for ways to make your reports more client-friendly, check out these tips to Simplify Google Ads Client Reporting.
Choosing the Right Metrics for Each Client
Not all metrics matter equally. When considering how to show google ads performance to clients, focus on what drives their business forward. Core metrics like conversions, click-through rate (CTR), cost per click (CPC), impression share, and quality score are a solid foundation.
But context matters. A SaaS client may care less about clicks and more about trial signups. Avoid vanity metrics that look impressive but don't translate to business value. Tailoring your reporting by industry and client goals means your insights are always relevant and actionable.
Step-By-Step: Building a Transparent Google Ads Report
Creating a transparent report is essential if you want to master how to show google ads performance to clients. Let’s walk through a practical process, step by step, to make sure your clients always know what’s working, what isn’t, and what’s next.
Step 1: Gather and Organize Data
The first step in how to show google ads performance to clients is making sure your data is complete and reliable. Pull data from the Google Ads dashboard, Google Analytics, and your CRM. Consistency matters, so set up automated monthly data pulls to avoid manual errors.
For many agencies, integrating conversion tracking is a challenge. If you want accuracy in your reports, follow Google Ads conversion tracking best practices for 2026. This ensures every click, impression, and conversion is tracked correctly.
Don’t forget to sync your data sources regularly. The more streamlined your process, the easier it is to tell a clear performance story to your clients.
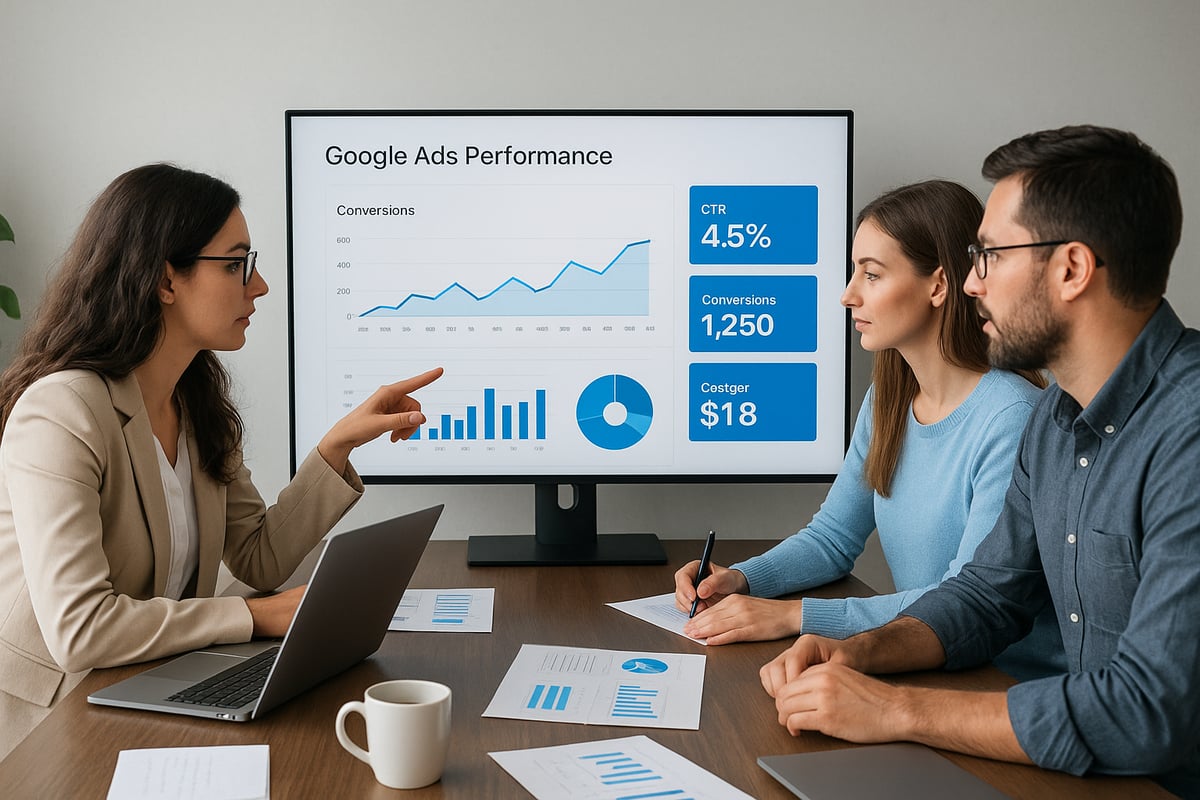
Step 2: Highlight Key Performance Indicators (KPIs)
Once your data is organized, the next phase in how to show google ads performance to clients is focusing on the right KPIs. Start by aligning your report with the client’s objectives. For e-commerce, ROAS should take the lead. For lead generation, highlight cost per lead.
Use data visualization techniques like color-coding or bold headlines to draw attention to what matters most. For example, set ROAS as a headline metric for an online store, or use a bright highlight for conversion rate changes.
Tailor the KPIs to each client’s industry. Avoid vanity metrics that don’t drive decisions. This keeps your reports actionable and meaningful.
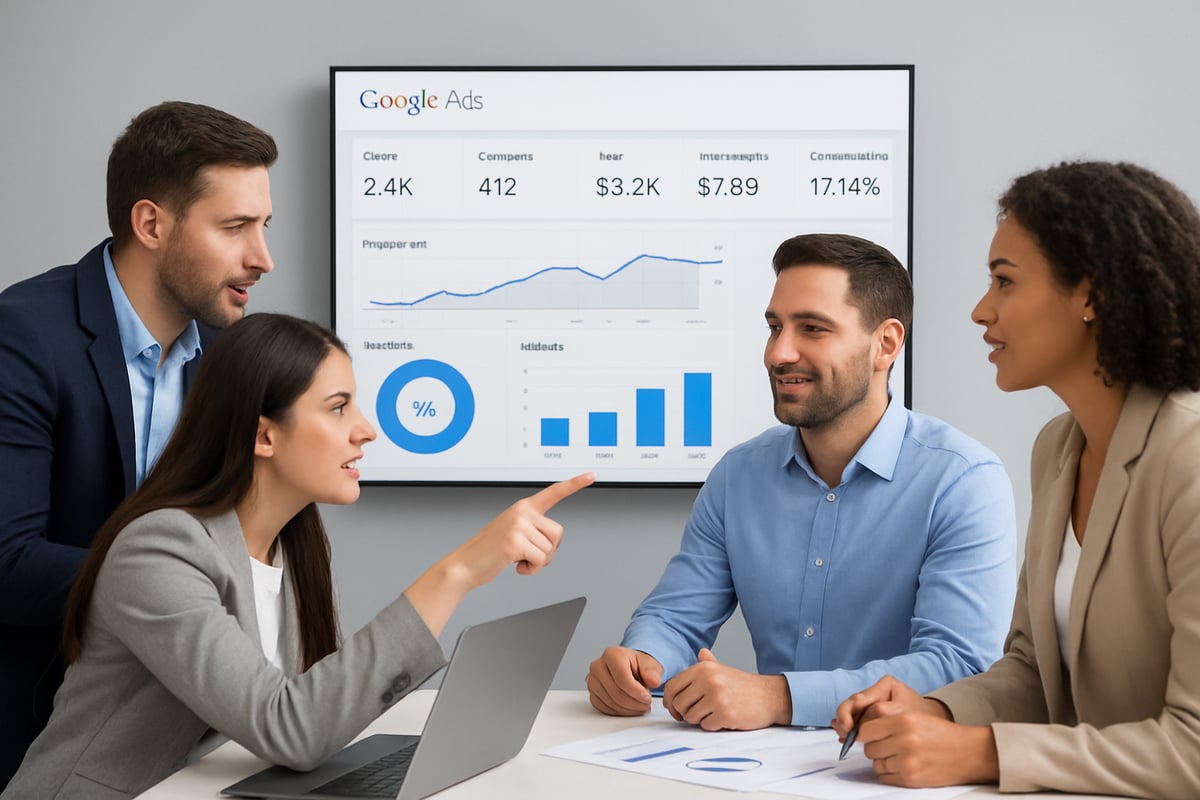
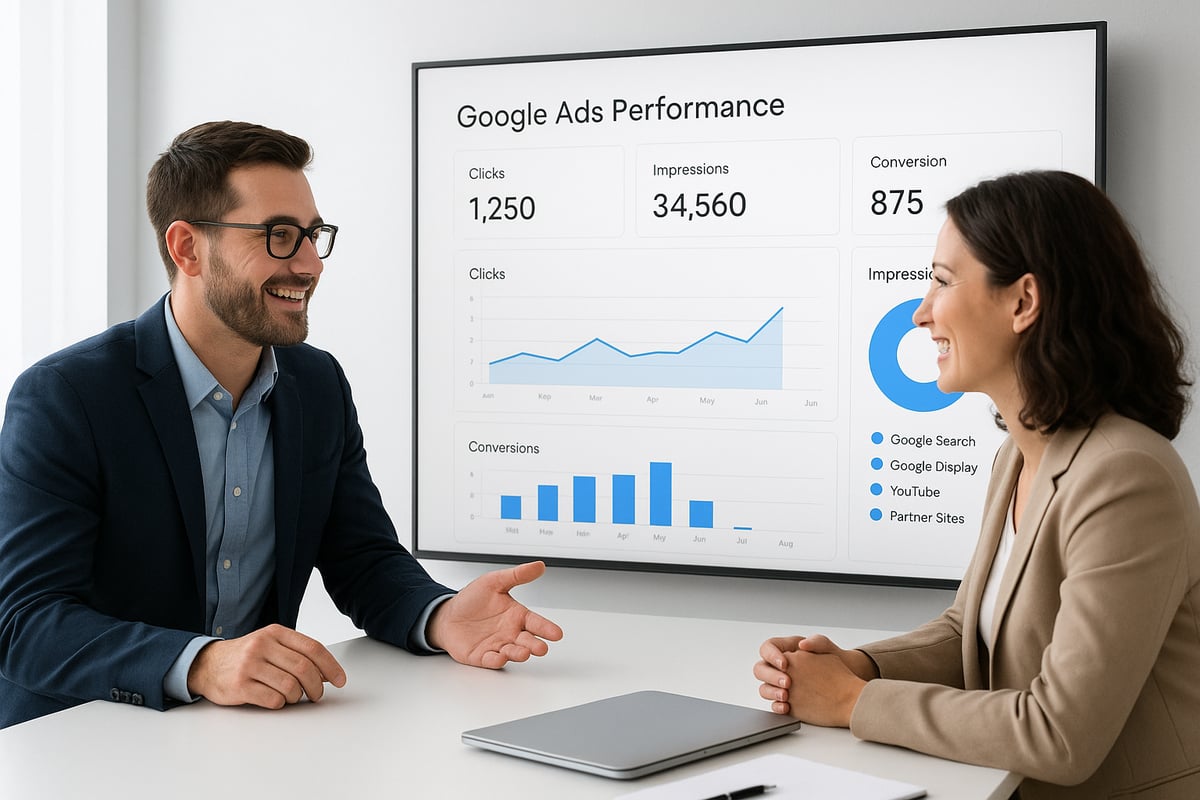
Step 3: Provide Clear Visualizations
Visual storytelling is at the heart of how to show google ads performance to clients. Charts, graphs, and heatmaps can make complex data easy to understand at a glance. Tools like Looker Studio and Tableau help turn raw numbers into clear visuals.
Try including a before-and-after graph to show conversion growth over time. Or, use a pie chart to break down spend by campaign. These visuals help clients see progress quickly, without getting lost in spreadsheets.
Keep designs clean and uncluttered. The goal is to make insights obvious, not overwhelming.
Step 4: Add Context and Actionable Insights
Numbers alone aren’t enough when you’re figuring out how to show google ads performance to clients. It’s crucial to explain not just what happened, but why. Write concise summaries for each main section of your report.
If a campaign’s CTR dropped after changing ad copy, point it out and recommend testing the previous version. If costs spike, suggest reviewing bidding strategies.
Always end with clear next steps. This turns your report from a static document into a roadmap for improvement, helping clients feel confident and informed.
Tools and Platforms for Effective Client Reporting
Choosing the right tools is key when figuring out how to show google ads performance to clients. Agencies face a crowded landscape of platforms promising streamlined data and beautiful reports. But how do you know which ones truly deliver?
Comparing Top Reporting Solutions
When it comes to how to show google ads performance to clients, the platform you choose can make or break the experience. Let's look at four leading solutions side by side:
| Tool | Customization | Automation | Integrations | Cons |
|---|---|---|---|---|
| Looker Studio | High | Yes | Google, others | Learning curve |
| Supermetrics | Medium | Yes | Many | Cost for add-ons |
| AgencyAnalytics | High | Yes | PPC, SEO, CRM | Price, setup time |
| Google Ads Reports | Low | Limited | Native only | Basic visuals |
Looker Studio and AgencyAnalytics stand out for customization, while Supermetrics is strong on integrations. According to Databox, 80% of agencies now use third-party tools for reporting. For a deeper dive into these platforms, check out this Top PPC reporting tools in 2026 guide.
Automating Reports for Efficiency
Automation is a game changer for agencies who want to master how to show google ads performance to clients without wasting hours on manual work. Scheduling reports means clients get updates on time, every time.
Automated tools can:
- Schedule delivery to email or Slack
- Pull fresh data from Google Ads, Analytics, and CRM
- Reduce manual errors and repetitive tasks
Agencies using automation save an average of 8 hours per client each month, based on AgencyAnalytics data. This frees up time to focus on strategy and results, not spreadsheets. Consistent, automated reporting also builds client trust, since they never have to chase you for updates.
Custom Branding and White-Label Options
First impressions matter, especially when showing clients their results. Custom branding makes your agency look polished and professional. Most advanced tools let you add your logo, brand colors, and even host reports on your own domain.
Benefits include:
- Consistent brand experience for clients
- Agency credibility and differentiation
- Easy-to-use client portals instead of generic dashboards
Imagine a client logging in to a portal that feels like an extension of your agency, not just another software. Custom branding is a small touch that can make a big impact when deciding how to show google ads performance to clients.
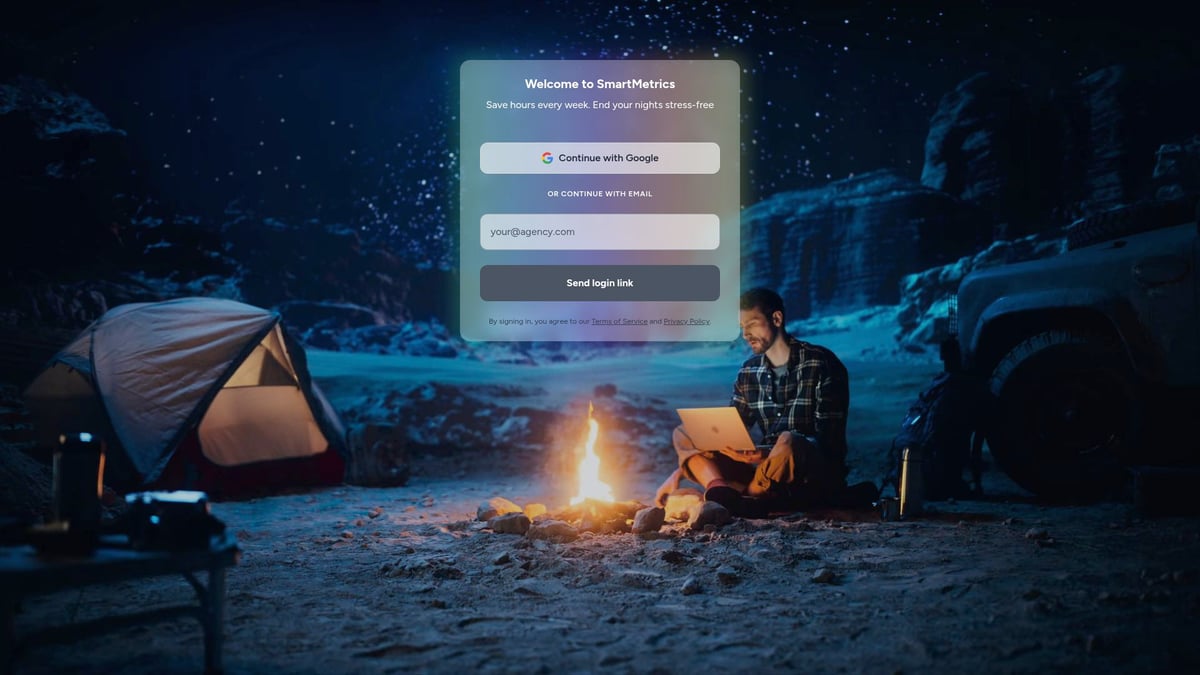
How SmartMetrics Streamlines Google Ads Reporting for Agencies
SmartMetrics is designed for agencies that want a seamless way to handle how to show google ads performance to clients. With branded client portals, automated audits, and real-time dashboards, agencies cut project timelines by over 21 days. Everything's consolidated in one place, making collaboration and reporting fast, clear, and impressive.
Best Practices for Presenting Performance to Clients
Presenting data isn't just about numbers. It's about trust, clarity, and helping clients truly understand how to show google ads performance to clients in ways that drive smarter decisions. If you want to keep clients engaged and confident in your work, focus on the way you deliver results as much as the results themselves.
Scheduling and Cadence: When and How Often to Report
Finding the right reporting rhythm is key when considering how to show google ads performance to clients. Some clients crave weekly updates, while others prefer monthly deep dives. The cadence you choose should fit the client's needs and campaign pace.
- Weekly reports provide quick snapshots, ideal for fast-moving campaigns.
- Bi-weekly updates balance detail and frequency.
- Monthly reviews allow for in-depth analysis and strategic discussions.
Consistency matters more than frequency. Set clear expectations early. For major changes or milestones, offer ad hoc updates to keep clients informed and confident.
Explaining Results in Plain Language
Even the most sophisticated metrics can lose value if clients don't understand them. When you think about how to show google ads performance to clients, always translate data into business outcomes.
Ditch the jargon. Instead, use analogies and simple stories. For example, "Your ads reached 10,000 new people—imagine filling a stadium with potential customers." This approach makes results relatable and memorable.
If you're looking for more tips on clear communication, check out How to Present Marketing Reports to Clients for actionable strategies that help bridge the gap between data and decision-making.
Handling Negative Results and Setting Realistic Expectations
Honesty is non-negotiable when discussing how to show google ads performance to clients, especially when results disappoint. Address underperformance openly, focusing on solutions rather than blame.
Frame setbacks as opportunities for growth. If clicks drop 12 percent due to seasonality, explain the cause, then share a proactive plan: "We'll adjust bids next month to capture more demand." This builds trust and highlights your commitment to improvement.
Clients appreciate transparency, especially when paired with actionable next steps.
Encouraging Two-Way Communication
Effective reporting is a conversation, not a monologue. Encourage clients to ask questions or share concerns during report reviews. Interactive dashboards or live sessions foster engagement and help clarify how to show google ads performance to clients in real time.
Agencies that prioritize open communication see 30 percent higher client retention, proving that dialogue is just as valuable as data.
Advanced Tips: Going Beyond Standard Google Ads Reports
As digital marketing evolves, agencies aiming to master how to show google ads performance to clients need to go beyond standard reports. Clients expect deeper insights, smarter predictions, and seamless integration with their business goals. Let’s look at three advanced approaches that can impress and inform your clients in 2026.
Integrating Multi-Channel Data for Holistic Insights
Clients rarely rely on just one channel for their marketing. To truly master how to show google ads performance to clients, you need to connect Google Ads data with platforms like Facebook, LinkedIn, organic search, and your client’s CRM.
For example, imagine a client’s customer journey that starts with a Google Ad click, continues through a Facebook retargeting campaign, and ends with an email-driven sale. By integrating these data sources, you can map out the full funnel, attribute value across channels, and answer the big question: which touchpoints drive real business results?
Try using tools that pull in multi-channel data to build unified dashboards. This approach not only clarifies performance but also helps clients see how their investment in Google Ads fits into the bigger picture.
Leveraging Predictive Analytics and AI
Agencies looking for the next level in how to show google ads performance to clients should embrace predictive analytics and AI-powered tools. These technologies use historical and real-time data to forecast trends, suggest budget adjustments, and flag potential issues before they impact results.
For example, predictive models can alert you to expected seasonal dips or highlight which ads are likely to convert best next month. Some platforms are even leveraging the latest Google Ads API features to automate deep-dive analysis and deliver smarter recommendations.
By explaining these insights to clients in clear, actionable language, you’ll move from just reporting numbers to actively guiding strategic decisions.
Staying Ahead: Trends in Google Ads Reporting for 2026
Staying current with trends is essential if you want to excel at how to show google ads performance to clients. In 2026, real-time dashboards and interactive reports are becoming the norm. Clients expect instant access to performance, not static monthly PDFs.
Privacy and data compliance are also top priorities. Agencies are increasingly shifting to first-party data strategies, using tools like GA4 and server-side tracking for better accuracy and compliance. For actionable tips, check out GA4 best practices for 2026.
By combining these trends with strong communication, you’ll ensure your agency’s reporting stays relevant, trusted, and ahead of the curve.
Now that you know how to turn complex Google Ads data into clear, client-friendly reports, you might be wondering how to make this process even smoother for your agency. With tools like branded client portals, automated audits, and real-time dashboards, you can save hours each month and impress clients with transparent, actionable insights. If you’re ready to put these strategies into action and streamline your workflow, why not give SmartMetrics a try? You can explore all their productivity tools and see how easy great reporting can be—Get Started for Free.
Put this into practice
Manage your agency smarter
SmartMetrics gives agencies the tools to track client health, automate reporting, run audits, and deliver a fully branded client experience — all in one place.
- No credit card required
- Setup in minutes
- Cancel anytime