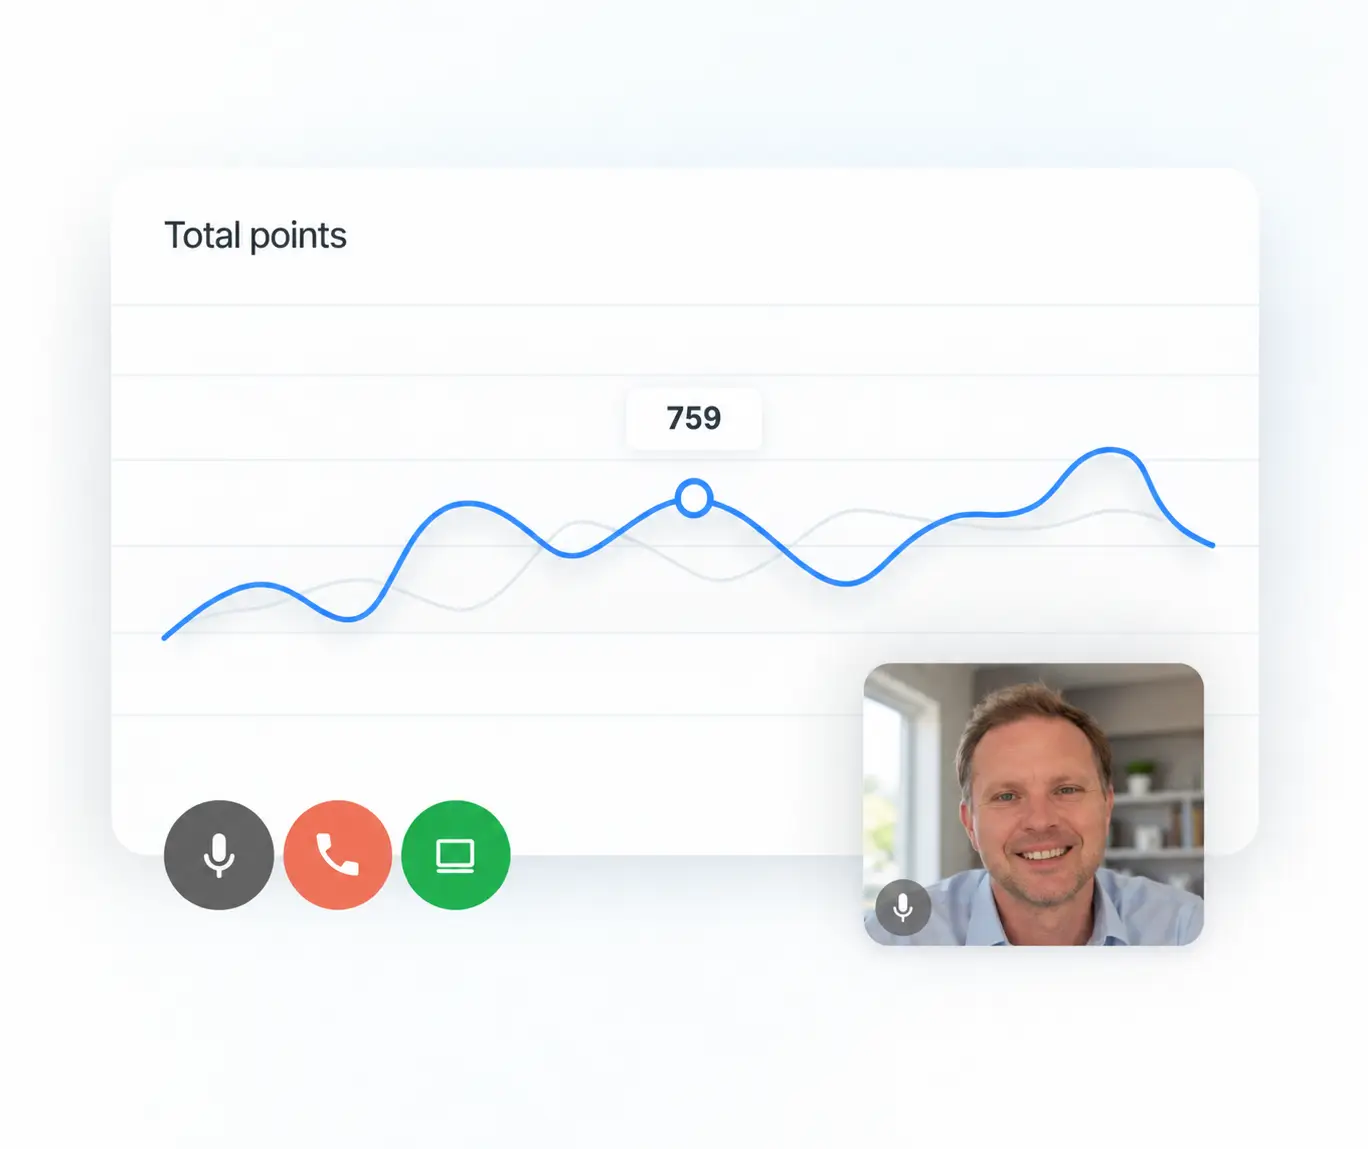

If you lived in Universal Analytics long enough, you remember the simple move. Build a dashboard. Drop widgets. Share a page leadership actually opened.
Then GA4 arrived and that muscle memory broke. For a long time the answer was reports, explorations, and a lot of Looker Studio (still often called Data Studio in old decks). Now GA4 has a real dashboard builder again. Scorecards. Tables. Lines. Bars. Donuts. Funnels. Drag and drop on a grid.
That is progress. It still does not cover every reporting habit teams built over the last decade. UA dashboards had their own problems. Clunky widgets. Weak sharing. Numbers that disagreed with Ads and the CRM. Nobody should romanticize them.
What GA4 dashboards get right
Google's current dashboard tool is useful when you want KPIs inside Analytics without hopping between five reports.
You get a single-page canvas. You place cards. You can publish into the left nav so editors and viewers with property access can open it. Editors and admins create and publish. Everyone else can still view what you publish.
Supported chart types cover the basics most operators need for a morning check. Sessions. Conversions. Channel mix. A short funnel. A scorecard with a date comparison.
If your audience already lives in GA4, a tight native dashboard beats a dusty PDF.
What still frustrates teams (and UA was no saint either)
UA dashboards felt familiar. They were also limited, easy to misread, and often turned into wallpaper nobody trusted. The pain with GA4 is less "UA was better" and more "the old muscle memory does not map cleanly."
GA4's model is event-based. Metrics do not map one to one. "Users" split into total and active. Goals became conversions. Segments do not behave the same way. Audiences only fill forward after you create them.
So a "migration" is usually a rebuild. Anyone who copied an old UA Looker report and expected clean field mapping already learned that the hard way.
Native GA4 dashboards also come with sharp limits today:
- Standard properties: up to 15 cards. Premium: up to 30.
- Published dashboards are shared with the whole property. No quiet personal board for the CEO only.
- No API for dashboard definitions.
- No segments the way UA users expect.
- No card-level comparisons.
That last set is why many teams still feel underserved. The canvas exists. Some governance and flexibility they want still do not.
Explorations are not a dashboard product
Explorations are strong for ad-hoc work. Pathing. Funnel digging. Segment compares for analysts with GA4 access.
They are weak as a shared operating board. Stakeholders should not need GA4 fluency to see weekly KPIs. If your "dashboard" only lives in an exploration, you will keep screenshots flying in Slack.
Where Looker Studio still wins
Looker Studio (Google's free report builder, formerly Data Studio) remains the default outside-GA4 board for a reason.
- Share a link without handing out GA4 admin access
- Mix GA4 with Google Ads, Sheets, CRM extracts, and other sources
- Multi-page reports, scheduled email, PDF export
- More chart types and community visuals than the native GA4 canvas
That is the real replacement path for a lot of old UA dashboard packs. Rebuild the story in Looker Studio on the GA4 connector, then fix the fields that do not auto-map.
It is not magic. The GA4 connector still hits Data API quotas. Busy pages with too many charts error out. Sampling can happen without a clear warning in Looker Studio. New GA4 fields sometimes show up in Analytics before they show up in Studio.
When the number has to be trusted for budget decisions, teams move the heavy lifting to BigQuery export and point Looker Studio at modeled tables. That costs more thought and money. It also stops you guessing whether the chart is sampled.
Note the naming trap. Looker Studio is not the same product as Looker, Google's paid BI platform. Most marketing teams mean Studio when they say Looker.
A practical stack that works in 2026
- Keep a small native GA4 dashboard for people who already open Analytics daily
- Build the stakeholder board in Looker Studio (Ads + GA4 + any CRM sheet you trust)
- If quotas, sampling, or history become the fight, plan BigQuery and stop stacking 40 live charts on one page
- Align CRM source and conversion names so the board matches pipeline, not vanity events
Native GA4 dashboards are a feature. They are not your full reporting system.
Where SmartMetrics fits
I wire the measurement layer so the board tells the truth. GA4 and GTM setup. Server-side where you need it. Looker Studio boards that match booked work, not just sessions. CRM handoff so marketing and sales argue less about whose number is right.
Send me what you run today. Analytics, ads, CRM. I will tell you whether a native GA4 dashboard is enough or whether Looker Studio (and maybe BigQuery) should carry the load. Quote in a day.


 Gray Digital Group
 Blitzy
 PermitFlow
 Dj Haer Jr