
Reporting & Dashboard Audit

Review of your Looker Studio and Databox reporting covering broken data sources, silent blend errors, metric definitions that disagree between dashboards, and filters nobody remembers applying.
What's included
Data sources
- Connector health across every source feeding your reports, including quota limits and sampling
- Blended data review, since Looker Studio joins default in ways that quietly drop rows
- Calculated field logic checked against the raw data
- Date range and comparison period handling, including the reports that break at month boundaries
- Refresh cadence, caching behavior, and stale data
- API quota usage and the reports failing silently under load
Metric definitions
- Metric dictionary showing how each number is defined and where definitions disagree across reports
- Reconciliation between dashboard figures and the source platforms
- Attribution model consistency, since one report on data-driven and another on last click will never agree
- Currency, timezone, and fiscal calendar settings
- Filters applied at page, chart, and source level, including the ones a former contractor left behind
Structure and usability
- Report inventory covering what exists, what gets opened, and what can be retired
- Client-facing report review for clarity, load time, and the questions it leaves unanswered
- Template review if you run the same report across many accounts
- Access control and sharing settings
- Naming conventions and version sprawl
Deliverable
- List of numbers currently wrong, with the corrected figures
- Fixes implemented on the reports clients actually see
- Documented metric definitions you can reuse across accounts
Why it matters
Reporting errors are the worst kind because nobody questions them. A blend drops the rows without a match, the conversion number comes out low, and a client makes budget decisions on it for eight months. Every chart renders fine. Nothing looks broken.
Templates make it worse at agency scale. One bad calculated field replicated across forty client reports is forty wrong dashboards, and you find out when a client cross-checks against the ad platform. Better to find it first.
What clients say
“Finding SmartMetrics was a real relief – as a research and education institute with a somewhat unconventional focus within Google Analytics, we previously struggled to find an online training program or consultant that could help us. SmartMetrics helped us to review our entire GA4 setup, and finalized multiple dashboards that addressed our subdomain website complications and redesigned our PDF download tracking. Tomas was clear, communicative and efficient, and took time to provide helpful advice at every stage of the project. We would definitely choose SmartMetrics again for future GA4 improvements.”
Micah Greyeyes
Yellowhead
“Thomas from SmartMetrics is not only easy to work with but is a wealth of knowledge. Thank you, Thomas!”
SmartWatt Marketing
“Tomas is an exceptional analytics expert. He helped us migrate a client from Universal Analytics to GA4, including creating GTM tags/triggers/variables, ecommerce tracking setup, other event tracking setup, and even built out funnels. This client had a unique shopping/enrollment checkout process, but the migration and configuration was launched without any issues. Highly recommended for any analytics work.”
Brian Thomas Clark
What clients say
“Tomas at SmartMetrics has been fantastic to work with. He consistently delivers high-quality work quickly, communicates clearly and proactively, and makes even complex implementations feel straightforward.”
 Gray Digital Group
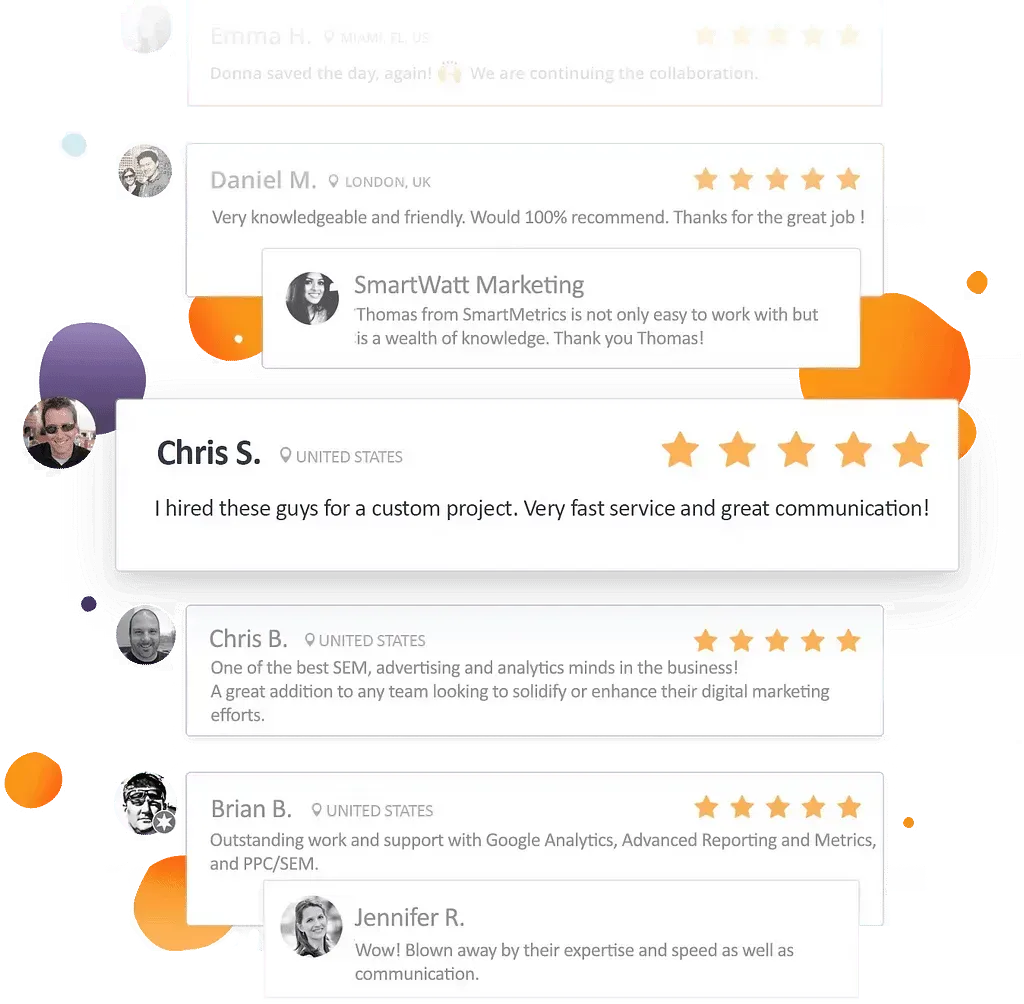 5.0 on Google · All reviews
“A huge difference to the business, and we know where the next dollar goes.”
 Blitzy
“We can scale spend now without guessing what is actually working.”
 PermitFlow
“Extremely knowledgable & capable!”
 Dj Haer Jr


Work with Tomas
Founder, San Diego, CA
20 years in marketing, CRO, CRM, and analytics. Now building the systems AI runs on.
You work with me directly, from scope to delivery. No account managers.